
Joomla guide v1.1.0
Visualize connects your MySQL databases, REST APIs and spreadsheets to Joomla dashboards: 9 connectors, 14 tables, scheduled reports and a native REST API.
Overview
Visualize connects your MySQL databases, REST APIs and spreadsheets to Joomla dashboards: 9 connectors, 14 tables, scheduled reports and a native REST API.
Requirements
- Joomla 4.4, 5 or 6 depending on the package version.
- PHP >=8.1.
- A recent backup before installation or update.
Installation
- Download the ZIP package and do not extract it.
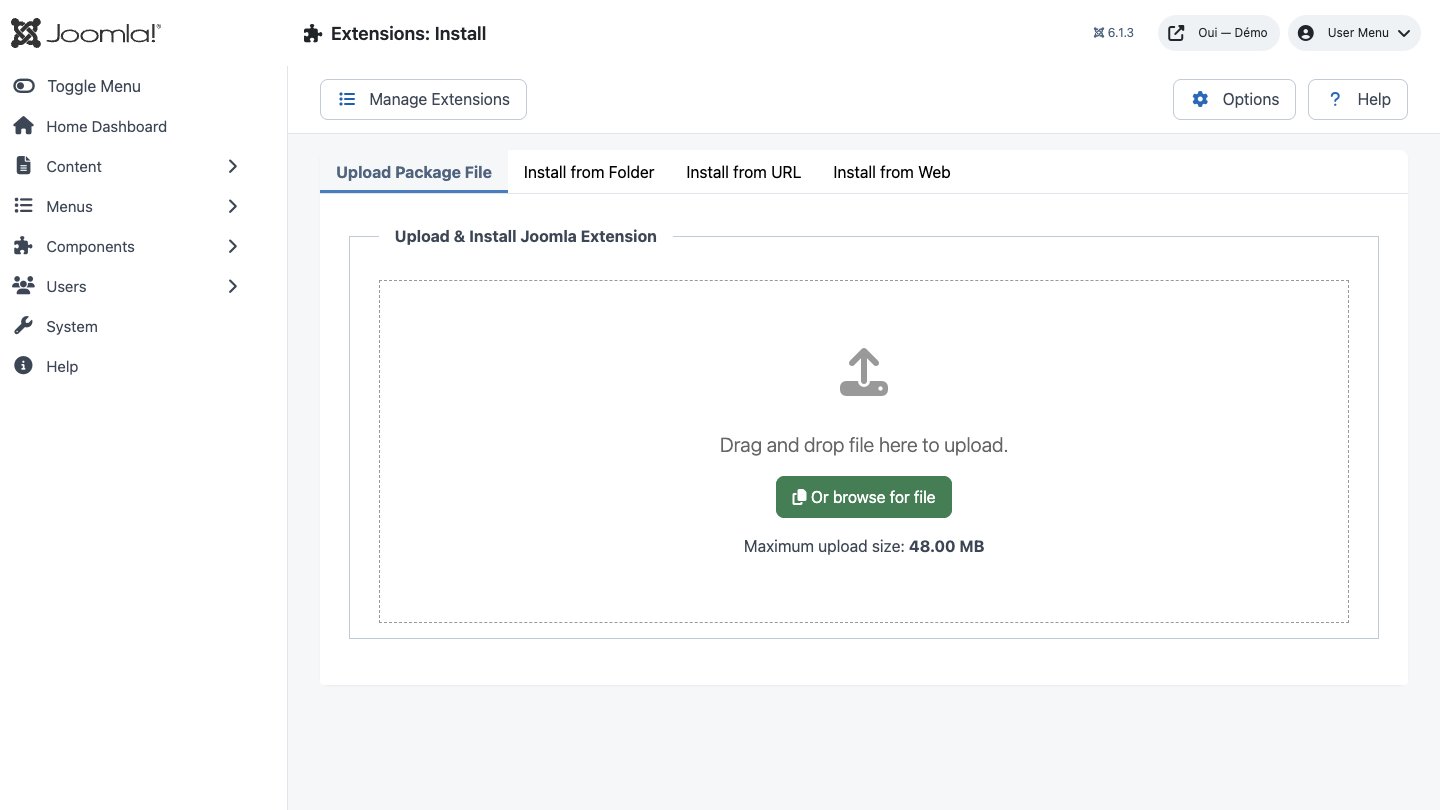
- In Joomla, open System → Install → Extensions.
- Drop the ZIP into the installation area and wait for the confirmation message.
- Open the component from Components. If the package includes a plugin, check its status under System → Manage → Plugins.
- Review component permissions before opening it to the team.
Initial configuration
- Open the extension dashboard.
- Open Options and review global settings.
- Grant Create, Edit, Delete and Configure permissions to the appropriate groups.
- Create a first test item and check the frontend when a public view is provided.
- Enable bundled plugins or scheduled tasks only when they are needed.
Features
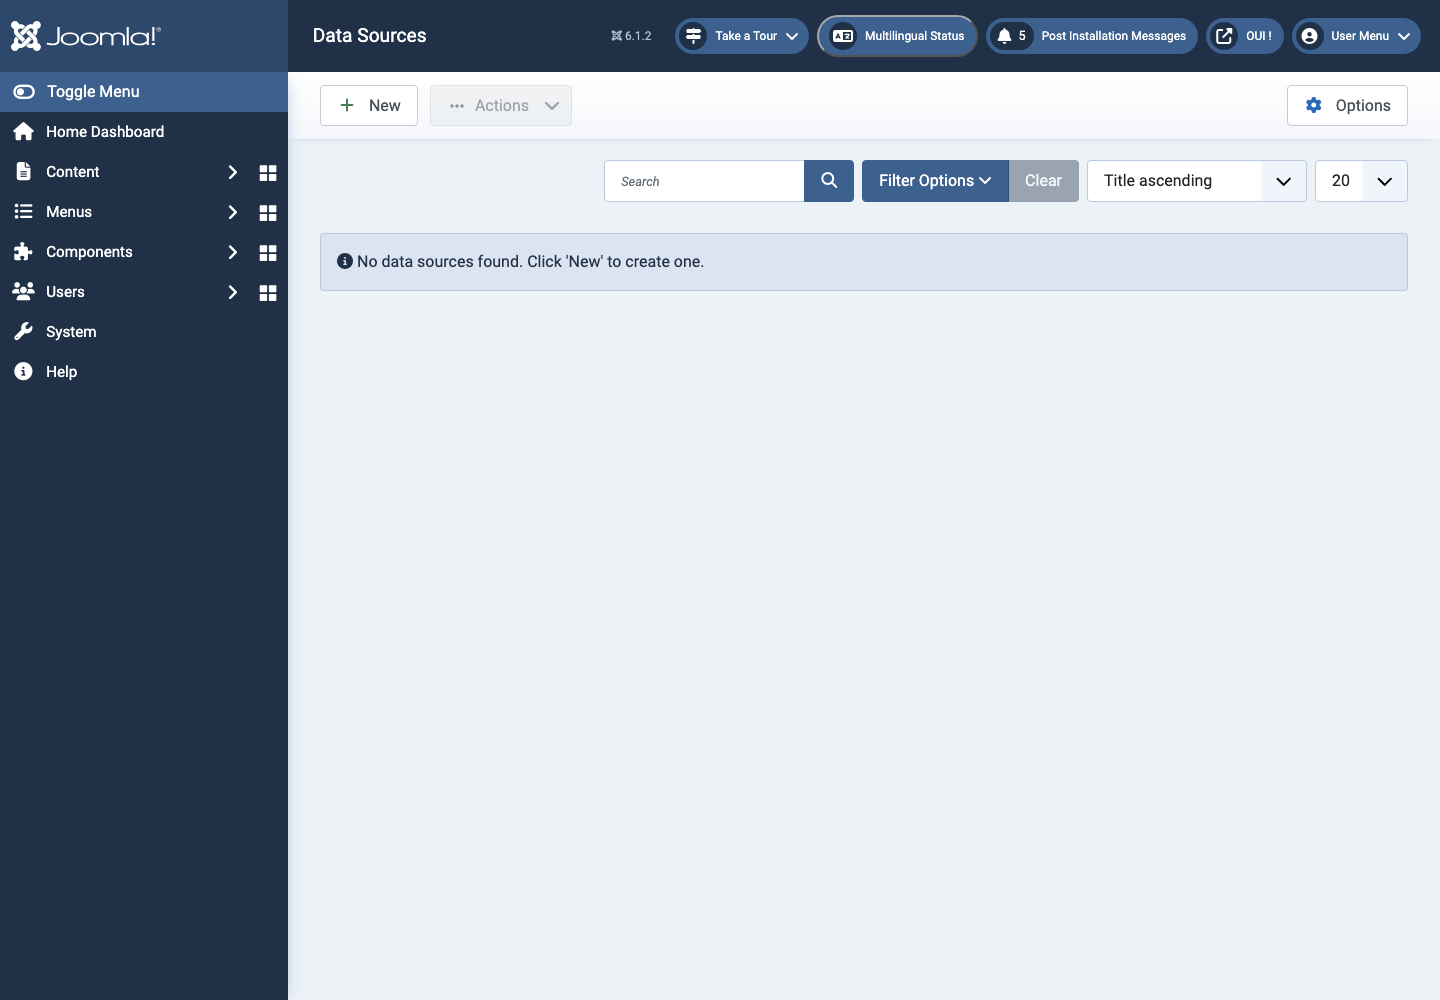
Datasources
Nine connectors, each shipped as a Joomla plugin. Every source is tested before it is saved, its schema is cached, and its sensitive credentials are encrypted with AES-256 before they ever reach the database.
Datasets
Three ways to build a query: visual builder, raw SQL, or an API expression. Joins, filters, aggregations, sorting, grouping, calculated fields and runtime parameters are all stored as JSON alongside the rest of your site.
Dashboards
Every widget carries its own grid position and size (x, y, width, height). Global filters, a default date range, a theme and an auto-refresh interval are set per dashboard rather than globally.
Widgets & charts
Rendering runs on Chart.js 4.4. Eight chart types are offered — line, bar, pie, doughnut, radar, scatter, bubble and area — alongside the single-figure KPI tile and the data table.
Scheduled reports
A cron expression, a timezone and a recipient list are all it takes: the report goes out on its own as PDF, Excel or CSV. Each run is recorded with its status, duration, row count and output file size.
Sharing & embedding
A dashboard can be published publicly behind a 64-character share token, or embedded as an iframe in another site. The list of permitted domains is configured per dashboard.
Manual data entry
Not every figure lives in a database. The manual connector creates a tabular dataset: you define the columns from six types — text, number, date, datetime, boolean, select — and type the rows in directly.
Declare a source
Pick the connector, fill in the connection form the plugin generates, and run the test. The detected schema is cached so the following screens open instantly.
First steps
- Start with a simple use case and non-sensitive data.
- Validate the result with the team that will use the extension.
- Record site-specific choices such as roles, automations, templates and integrations.
- Roll out gradually, then monitor logs and user feedback.
Screenshots
Troubleshooting
- The extension does not appear after installation
- Check the installer message and the component/plugin status, then clear Joomla or WordPress caches.
- An action is denied
- Review the user group permissions, session token and any security restrictions.
- The output does not match the site
- Test with caching disabled, inspect template overrides and look for CSS or JavaScript conflicts.
- An external integration fails
- Check the URL, credentials, quotas and logs without copying secrets into a support request.
Updating and uninstalling
Before updating, back up files and the database, read the release notes, and test on a copy of the site. Export useful data before uninstalling. Removing a package may remove several related components, modules or plugins.